The Resource Clan
TRC is a Top-notch IT company providing services with a focus on quality and value-add.

TRC is a Top-notch IT company providing services with a focus on quality and value-add.

TRC is a Top-notch IT company providing services with a focus on quality and value-add.
1 Year +
Financial Data

Social Market Analytics goal was to harness the massive amount of unstructured financial data across both Alternative and Traditional sources into machine readable feeds and market intelligence. Data needs to be specifically designed and developed to integrate with existing quantitative models commonly used in the financial industry.
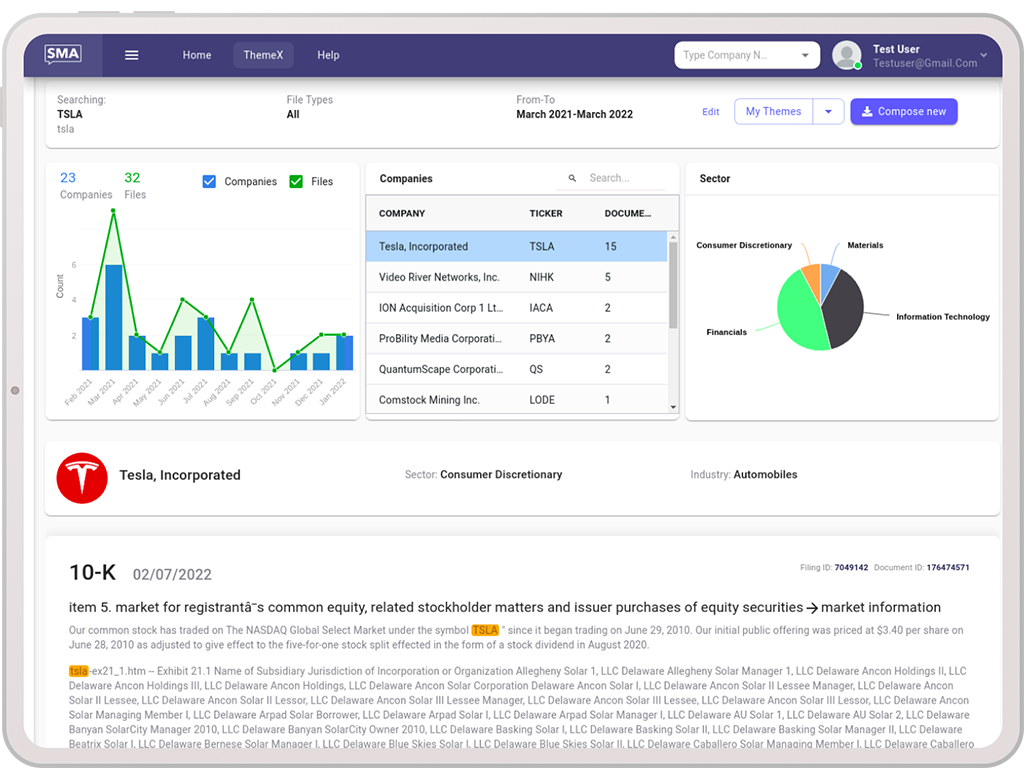
After building up the data in organized structure, the one of biggest challenge was to create a UI which is easy to understand because showing complex financial data in simple table and graphs was not enough. This UI should be built in a way that expert traders and users with less trading experience are comfortable using it.
Expertscloud already had a team who had worked on a similar kind of project where we developed data pipelines for streaming trading data from Nasdaq. Our team also had a good understanding of trading concepts. With all these expertise we were quickly able to start this project. We completed the first module of structuring data with optimized algorithms within a few months.
In the second module, we started working on web application where we presented the data results in tabular and graphical format. We used complex third-party libraries for showing tabular data the way the client wanted.
The Resource Clan already had a team who had worked on a similar kind of project where we had to build data pipelines for streaming trading data from Nasdaq. Our team also had a good understanding of trading concepts. With all these expertise we were able to start this project quickly. We completed the first module of structuring data with optimized algorithms. After building up the data the real challenge was to fix the data in accurate manner so that when the models are using data, we can get the right results. We created an automated solution for fixing data sets.
In the 2nd module, we start working on web application where we represented the data results in tabular and graphical form. We used complex libraries for showing tabular data. Moreover syncing of real-time data from data providers was done by building data streaming pipelines and data parsing engine.
This application was one of the first applications to normalize Social Media Data into Predictive JSON API data feeds. Twitter and StockTweets were processed into two separate APIs. SMA supports Quantitative Trading across Long Only, L/S, Market Making, Algorithmic Execution, Asset Management, Risk, Research, and Market Intelligence. Out-of-sample historical data for back testing goes back to December 1, 2011. This application is changing the way Traditional data sets are ingested by turning any document into machine readable textual data with quantitative metric overlays. Delivering Real Time APIs and provides historical baselines for quantitative analysis go back as far as 1996